數據庫下載: 與自己的差異基因進行搜尋及比對
AnnotationHub 是生物數據庫的中轉站,方便搜尋目標數據,另一個相似套件為 biomaRt
參考網址:https://www.jianshu.com/p/ae94178918bc
source(https://bioconductor.org/biocLite.R)
install.packages(BiocManager)
BiocManager::install(c(AnnotationHub,BiocGenerics,parallel))
library(AnnotationHub)
ah <- AnnotationHub()
ah
#版本是2018-08-20; 目前有45768條紀錄
unique(ah$dataprovider) #數據來源
unique(ah$species) #支持那些物種
ah$species[which(ah$species == 'Gallus gallus')] #查詢Gallus gallus是否存在資料庫中
gallus <- query(ah, Gallus gallus)
gallus #列出有 Gallus gallus這個物種的資料庫有哪些
ah[ah$species == 'Gallus gallus' & ah$rdataclass == 'OrgDb']
subset(ah, species == 'Gallus gallus' & rdataclass == 'OrgDb') #用R內建功能查詢有Gallus gallus且屬於\'OrgDb\'的數據庫
display(ah) #圖形化介面操作
deseq2.sig <- subset(res, padj < 0.05 & abs(log2FoldChange) > 1) #數據篩選,p<0.05,且log2>1
unique(ah$rdataclass) #AnnotationHub的註解訊息存放格式
gallus['AH61772']
org_gal<-ah[['AH61772']] #[[]]為下載數據庫,編號就是對應自己要搜尋的數據庫
str(org_gal)
mode(org_gal) #調查數據模式為S4
class(org_gal)
keytypes(org_gal);columns(org_gal) #搜尋可以輸入的基因名稱格式 (兩種函數皆可)

keys(org_gal,keytype = 'ENTREZID') #查詢某一基因輸入格式有那些,keytype指定輸入格式
select(org_gal,keytype = 'SYMBOL' ,keys= 'ENO1', columns= c( 'UNIGENE','GENENAME','ENTREZID','GO')) #從資料庫搜尋基因。
#key:關鍵字(須符合基因格式);column:欲列出的項目(格式),一個基因有時會有多個GO
GO 分析
BiocManager::install(clusterProfiler) #使用富集分析會用到的package
library(clusterProfiler)
BiocManager::install(fgsea)
library(readxl) #可以讀入excel的package
# 以這組基因列表當練習: https://drive.google.com/open?id=1KTrQqok9cm5kPneo-Z8dWGEHaCNseUjp
#引用來源: https://www.sciencedirect.com/science/article/pii/S0306456518302456?via%3Dihub#f0020
#由於該文獻只有提供GI number,所以用DAVID的Gene ID Conversion Tool轉換成ENTREZ,不過原本有103個差異基因,轉換後只對的到70個
GO<-read_xlsx('GO.xlsx',col_names = T) #輸入資料,差異表達的基因 (ENTREZID命名格式)
BiocManager::install(enrichGO)
library(DOSE)
GO_BP <- enrichGO(gene =as.character(GO$ENTREZ_GENE_ID), #輸入的基因列表需轉換成字元
 OrgDb = org_gal, #物種註釋數據庫,使用NCBI的database
 keyType = 'ENTREZID', #gene命名格式
 ont= 'BP', #選擇基因功能: 是BP (Biological Process), CC (Cellular Component), MF (Molecular Function)
 pAdjustMethod = 'BH',
 pvalueCutoff = 0.05,
 qvalueCutoff = 0.2,
 minGSSize = 10, #每個基因集最小數目
 maxGSSize = 500, #用於測試的基因註釋最大數目
 readable = FALSE,
 pool = FALSE)
write.csv(summary(GO_BP),'GO_BP.csv',row.names =FALSE) #寫出GO分類表格

dotplot(GO_BP,x= 'GeneRatio',font.size= 10,color ='p.adjust',showCategory = 20) #泡泡圖, x可以改成以count表示,font.size: 文字大小; showCategory: 顯示的分類數,從p值最小的開始顯示。其他像是格式或是圖形樣式也可以變換,但我還沒摸熟。
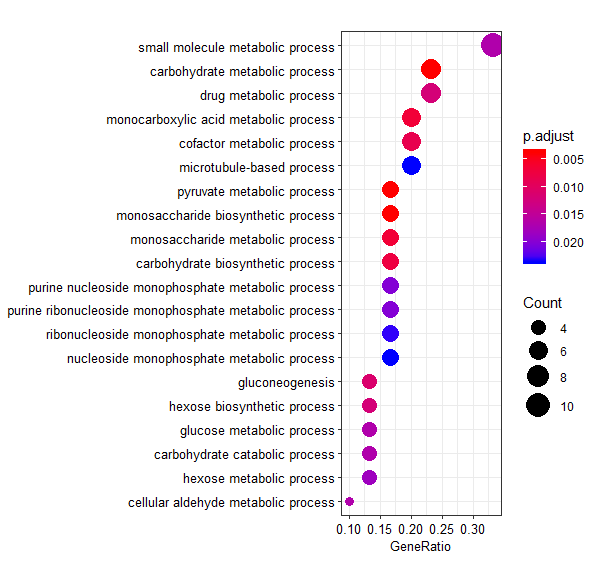
barplot(GO_BP,x=GeneRatio,font.size= 10) #也可以繪製長條圖

enrichMap(GO_BP, vertex.label.cex=1.2, layout=igraph::layout.kamada.kawai) #該功能無法再使用,改成emapplot()
emapplot(GO_BP, showCategory = 20, color = p.adjust, layout = kk,vertex.label.cex=1.2) #網絡圖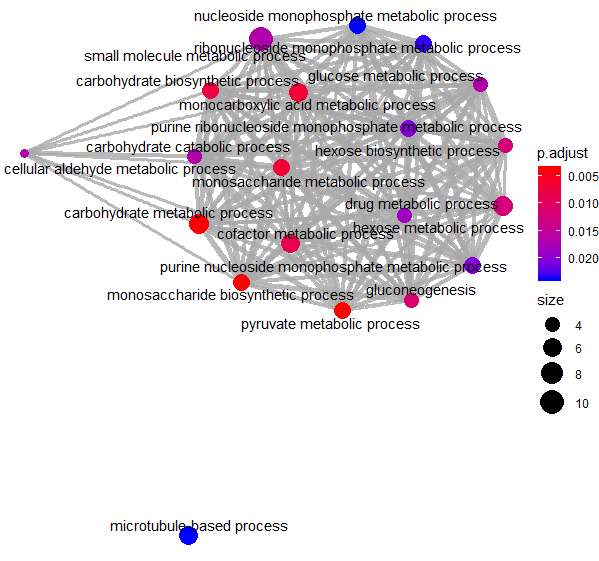
library(stringi)
BiocManager::install(topGO)
BiocManager::install(Rgraphviz)
plotGOgraph(GO_BP) #GO圖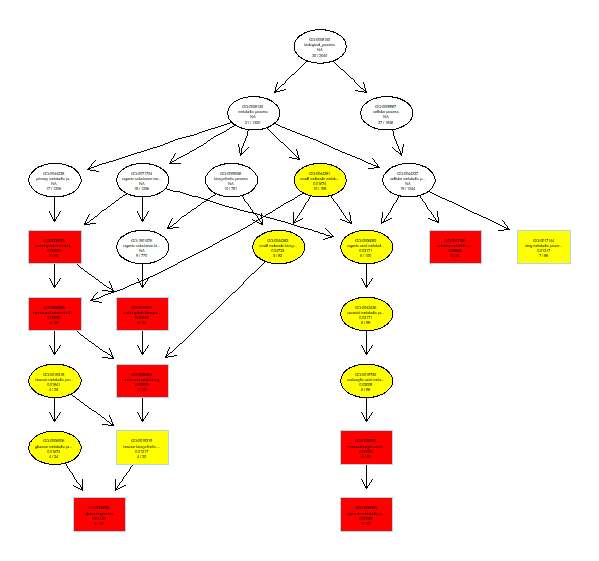
GSEA 分析
genelist<- GO$foldchange #指定基因差異的倍數,或是其他差異的程度
names(genelist)<- GO$ENTREZ_GENE_ID #差異倍數綁定基因名稱
genelist <- sort(genelist , decreasing = T) #排序差異程度高到低 (為符合格式需求)
gsemf<- gseGO(geneList = genelist, ont = BP, OrgDb= org_gal, keyType = ENTREZID, exponent = 1,
 nPerm = 1000, minGSSize = 10, maxGSSize = 500, pvalueCutoff = 0.05,
 pAdjustMethod = BH, verbose = TRUE, seed = F, by = fgsea)
#若排序的有相同的值就會無法計算 https://www.biostars.org/p/222431/
head(gsemf)
#由於這組genelist的pvalue= 0.05的話會沒有資料 (no term enriched under specific pvalueCutoff)
gseaplot(gsemf, geneSetID=1)
因此使用範例示範
library(DOSE)
data(geneList)
x <- gseDO(geneList)
gseaplot(x, geneSetID=1)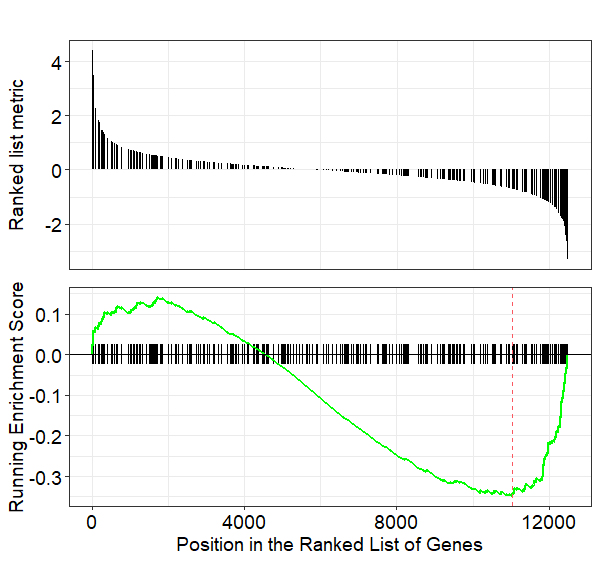
KEGG
kk <- enrichKEGG(as.character(GO$ENTREZ_GENE_ID), organism=gga,
 keyType = ncbi-geneid,
 pvalueCutoff=0.05, pAdjustMethod=BH,
 qvalueCutoff=0.1)
head(summary(kk))
dotplot(kk)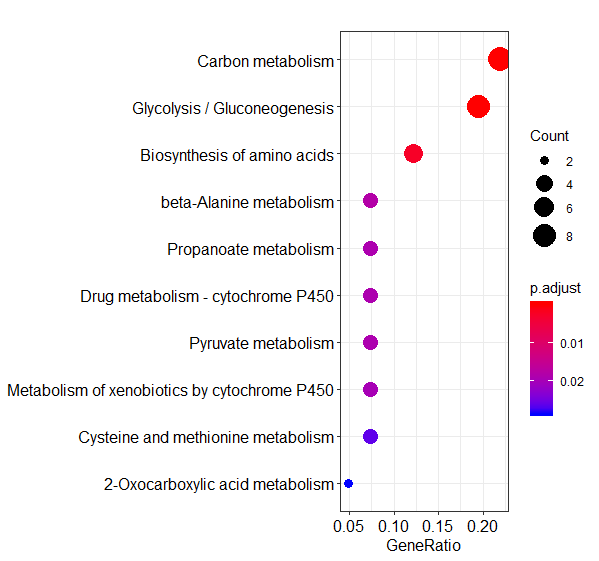
查看特定 pathway
BiocManager::install(pathview)
library(pathview)
hsa04750 <- pathview(gene.data = geneList,

 pathway.id = 'hsa04750', #上述結果中的hsa04750通路

 species = 'hsa',

 limit = list(gene=max(abs(geneList)), cpd=1))
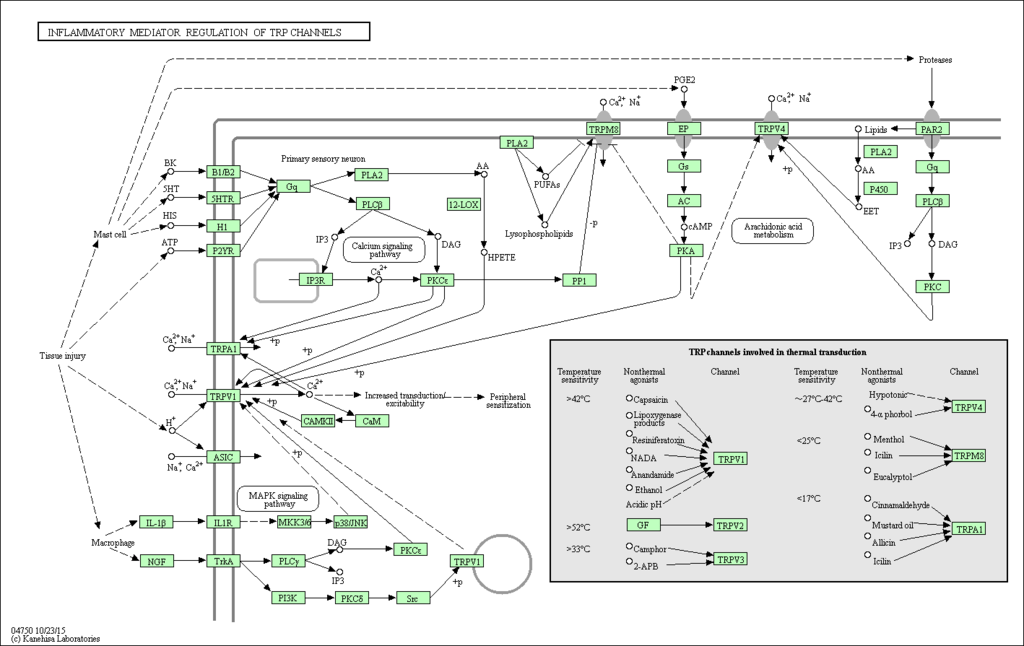
以上分析主要參考來源: https://www.plob.org/article/11508.html
還有很多功能沒有探索,再找時間跟精力補齊吧 QQ,歡迎指教跟討論。

